Preface
In the past 2 years, I spent about 70% of my working time to build, to break, and to fix data products. This article is a brief retrospect of my understanding on building the whole systems, as well as what kind of tools could be plugged as components.
Goal of a data System
We use data to understand reality and improve our product. This is the primary goal of a data/metric system. A good data system answers question, a better data system identifies root causes, and an even better data system help improve the whole system directly.
Use cases
In Yahoo!, the data platform I am working on mainly support a Personalization System (Recommendation system). During the iteration of the recom system, we follow and forecast what would be the actual use cases for the team to understand or to improve the Recom system. The major use cases for our system includes:
- Understand system performance with reports from different key metrics
- Detect / identify metric abnormal / data pipeline failure
- Collect user feedback data to improve system online in short cycle
- Make it easy for PM/Dev/Scientist to play with data
For different stage, we focus on different aspect and use different tools / techniques to solve problems. Let me illustrate.
Stage 1: System Validation

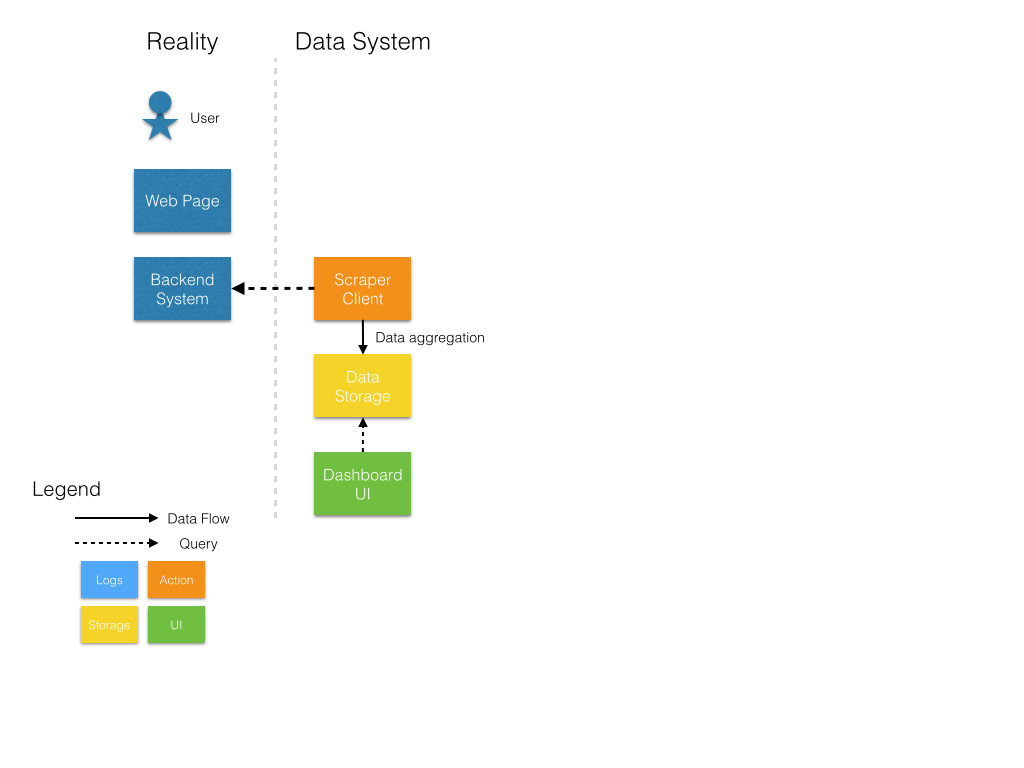
In this Stage, both the recom system and the metric system are in prototype status. As data team, our top priority is to use data to identify whether the recom system work as expect, which means we care about our services more than our actual user at this stage. So we apply a “scraper”, mocking thousands of different queries to visit our backend system. Then extract the instrumentation we are interested in, and compare with our design using different user profile to generate And the above graph show a scraper pattern.
- We build a scraper to send multiple mock requests
- Analysis the statistical result from response of mock requests
- Write the statistical result to a local MySQL.
- The front end of data product call MySQL directly to get data and render
Stage 2: Report System Performance Metrics

Now we start to care more about user, we want to know how user in different segments interact with our business product. Thus we collect a user behaviour log (which is not produced from our side), and compute metrics like Retention Rate and CTR(click through rate) to measure user’s engagement.
Before starting to expand our system, let’s review our use cases: “Understand system performance with reports from different key metrics”. Two estimation should be considered: volume of data & latency of report.
For volume of data, we should be aware of the “dimension explosion” effect. For example, we might have a user location segment/dimension when reporting our DAU metrics, if the location are split by nations, maybe 50 times of volume are needed, if the location are split by city, then the number will be much scary. This is only 1 dimension. Think about combination of different dimensions. The segment might based on age of the user, location of the user, login status of the user, the A/B test id, etc. the combination of dimensions will soon explode to a number you might not imagine before. So here we have to come up a solution of scalability.
While volume of data might vary, latency of report should be the same. Instant response is our goal. A low latency should be a must have features.
When interpret them into a design goal, they should be:
- Highly scalable
- Low latency on read queries
Storage
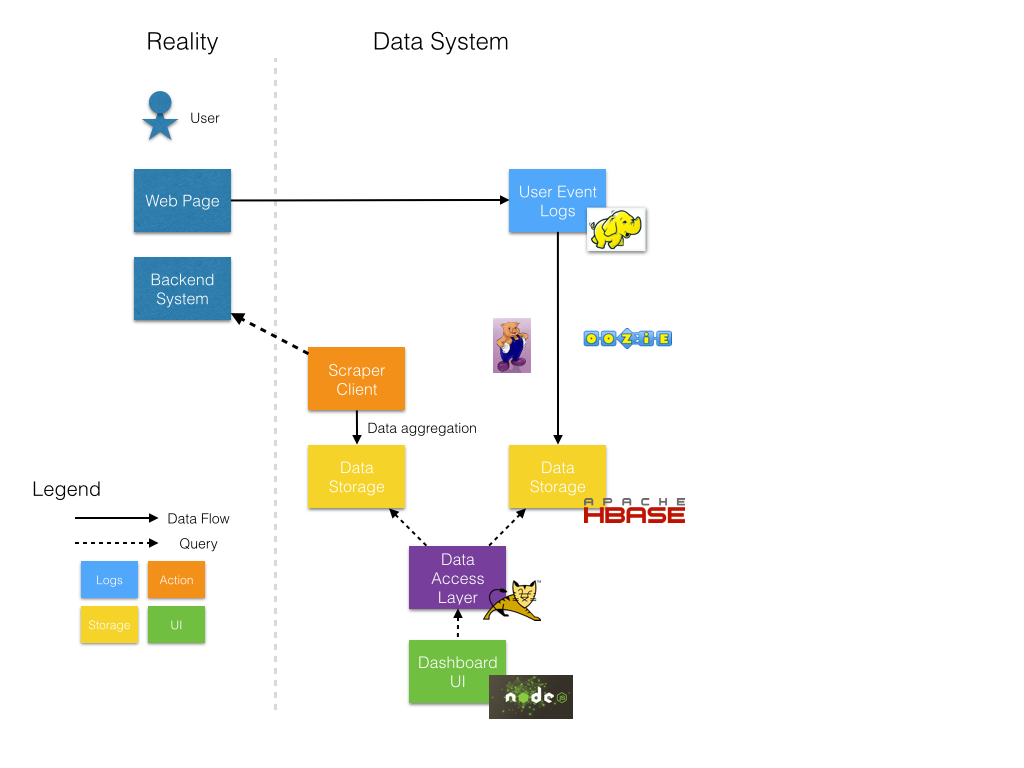
First of all, using Hadoop is natural,
- User behaviour logs (TB / daily) are aggregated on HDFS
- Hadoop is still a very good playground for such data manipulation.
Considering the data volume / latency factor, We select HBase in our data storage layer.
- Scalable when data volume increase
- Friendly integration with HDFS and other Hadoop projects
- Good (enough) latency on range query
- No relation query use case in predictable future
Some alternative might have their shortcomings, such as Hive could not provide instant response, and it take many maintenance effort to scale MySQL and keep data in sync.
After stack selection done, we should figure out a general schema design. In most report system, schema cover “metric id/name”, “dimensions”, “values”. Since HBase is a rowkey based KV database, so this is also about designing the construction of rowkey, to make it represent “metric_id/name” and “dimensions”, and be backward compatible.
And this is our rowkey schema:
1 | hash|metric_name^dim1_val^dim2_val^...|timestamp |
This schema provide following features:
- Load Balance. Hash is used as a load balanced technique by HBase, generated from md5 of “metric_name” + “dimensions”. This could guarantee that for the same combination of metrics and dimensions, they could fall into the same region server indicated by the hash value.
- Scanning operation is also efficient, since rows are sorted by row key. So same metrics with same dimensions are clustered and sorted by the timestamp. Given a time range then we could define a start row and end row to scan the rows between.
- Backward compatibility. Note that not all metrics share the same dimension. A shared configuration is used to store rowkey definition for different metrics. Dimensions are added sequentially in rowkey. For example, for metric M with dimension P, Q, the key looks like “M^p^q”. when adding a dimension S, the key looks like “M^p^q^s”. However, sometimes we want to ignore dimension S in the report. At this time, trailing empty dimension will be omitted in rowkey. We will still get “M^p^q”, which is backward compatible with the rowkey without the new dimension S.
Data Pipeline
Most data pipelines are actually taking ETL operation against data. In our cases, ETL against logs mainly output aggregations number on limited fields. A more reasonable and natural choice on Hadoop is Pig instead of Hive. See more from Alan Gates’ summary. With the support of UDF (which could be written in Python/Ruby/JS), constructing an ETL data pipeline is effective.
Scheduler
Another tools we need is job scheduler. If we want to generate regular daily report, the most straight-forward way is to start a cronjob to run the report generation pipeline regularly. But in real world, a pipeline might have external dependencies. In our case, we have to wait till the user log is available then we could start. Sure we can write a loop in the crontab to wait, or trigger this job with a reasonable delay? But how long should we wait? How could I start my pipeline once the dependency is ready? what if we have multiple dependencies?
Besides, the pipeline topology should be taken cared. A pipeline in our case cover at least 2 steps: metrics generation and persistance. Each one is a different job. We should also trigger persistance job or fail the pipeline once the generation job succeed / failed.
Apache Oozie came out and it save us tons of efforts. On many cases, we use it as a data-trigger, when all dependency data is ready, trigger a series of jobs.
Data Product Serving
To secure our backend data and as a more regularized way to manage data, we implement a Serving layer using Tomcat. Since most operation happened in data products are READ operation, we mainly focus on RPS of Serving. For a internal report system, this layer could be very light weighted.
Frontend
We made our FE more user-friendly by leveraging Bootstrap (For page Layout/CSS), Highchart (For the charting module). Node.js is used to communicate with Serving.
Stage 3: Expand Ecosystem
As the number of reporting metrics increase, some other problems / requirements emerged. We integrate more component to solve real world problems such as monitoring, metric self-service, online machine learning.
Abnormal Detection
As number of pipelines increases, probability of a broken pipeline also increases.
First of all, data dependencies matters. Here data dependencies is actually a topology dependency, which mean pipeline A need pipeline B’s output as input. thus A depends on B. When pipeline B breaks or delays, pipeline A will also get blocked. Thus we get metrics delayed. For time sensitive metrics, detecting such issues become more important.
Secondly, we’d like to detect abnormal value in metrics. For example, if Ads CTR become 0 after a release, we definitely want to get some notifications immediately instead of knowing revenue of the past week are blank one week later.
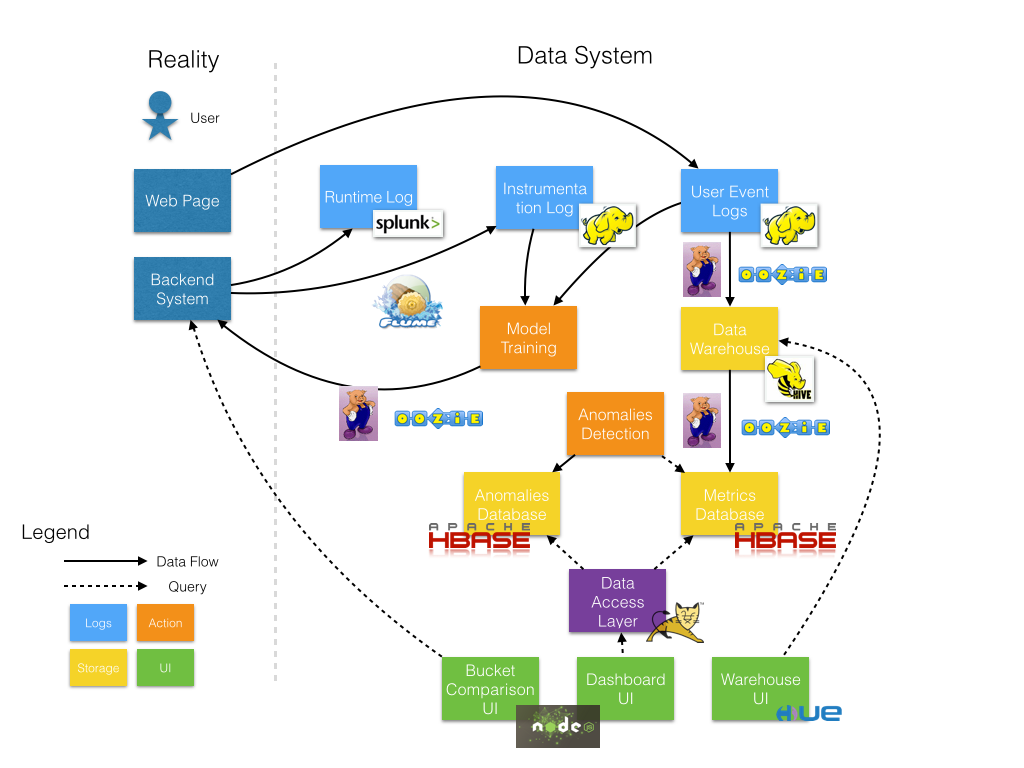
So a detection system is implemented. For metric delay issue, we label each pipeline with expected running time, then detection system system build data dependencies graph according to configs and source code of data pipeline. Then we scan the intermediate data on HDFS to see whether each pipeline have produce output.
In this way, we have enough information to get status of each pipelines. If delay occurs, we will be able to know why.
To detect metric abnormally, we also define our metric detectors, which use configurable parameters to control detect algorithm. With a series of metrics data as input, could apply numerous algorithm to detect metric abnormal.
One surprise finding is that, using a fixed threshold is one of our best friend if quality of source data could not be guaranteed. (To be illustrated)
Ad-hoc Query
Now we have more and more data, people wish we could help answer their questions using our existing data, QUICKLY. With our previous architecture, such requirement / enquiry often require us to build and launch a new data pipeline (even not regularly), because the enquiry could not be computed from our existing metrics. It is not cost-effective for following reasons: 1. it take human resources to finish such a task. 2. communication cost is un-imaginable big especially for people in remote office.
To make good use of data and reduce engineering efforts, we decided to build a data-warehouse: Store atomic data for both metric computation and ad-hoc query. Since the enquiry are mostly relational (Such as “what are the top 100 publishers (get most clicks) among mid-age user?”), we use Hive(https://hive.apache.org/) to build our data warehouse. With Support of HCatalog(http://hortonworks.com/hadoop/hcatalog/), Pig and Other MapReduce could easily access / operate data in Hive.
Also an user interface is necessary for a data warehouse, currently we are using our own UI, and will switch to Hue(http://gethue.com/) in near future.
Logging & Model Feedback
Now also think about the essence of our system, data. As we could see, we collect only the user feedback data from the UI layer. For a recommendation system, logging runtime intermediate results will be helpful to build ML model when combined with the user feedback data. But it’s not clever to return these results to front-end (User UI) because it will increase latency so the data should be logged at server side and send to somewhere (in our case Hadoop). Also the Server has it’s own duty, so this logging pipeline should be as light-weight as possible.
We finally choose Flume as our logging framework. For each server, a Flume client is added and it help we send data to HDFS via memory & sockets. No Disk I/O is needed.
Once we have both logs from server and user, we are able to join them together and get labeled training data, thus we could run ML training pipelines to generate new model. After necessary validation, we could then upload the model for recommendation server.
Also, a handy way to check error log is helpful for debugging issues. We deploy a Splunk instance to collect system log, and provide an real-time search UI to the team member. So engineer could easily check what types of error happened for each machine with a unified way instead of logging in to each machine remotely.
Lesson Learned
Simplify the Metrics
Complicated metrics make itself hard to understand, hard to compare, and error-prone in the computation stage. Also, try to limited the number of metrics to make important decision, we could seldom make a decision when some number is encouraging us to move forward when some saying NO if there is too many metrics for optimization goal.
Manage Metrics Life Cycles
When a metrics is no more used, retire it. It takes resource to maintain a metric/pipelines. It’s much easier to retire a metrics than to deprecate existing code: just stop the pipeline. With version control (or even better continuous integration) support, we could restart it very soon in with a simple click.
One way to identify which metric should be retired is “Don’t ask”, trust numbers. People are afraid of losing existing property. So when ask “May I retire these metrics”, we get “please don’t” for most cases. In our team, we setup a service to collect the logs to identify how many times the metrics have been requested by user, determine a threshold to filter some candidates, stop the pipeline with or without enquiry. Do it monthly.
Define Project Goal Clearly
- Who will be our major user? Is it an internal tool? Or is it for business partner or real user?
- How long this projects suppose to support? How long the data suppose to support?
The answer greatly impact our future decision of design and resources allocation.
Understand and Clean data
- Equip data expert so won’t get lost when facing data quality problem
- Manage dimension explosion. We might get more data rather than what we expect because of some special cases. Try to remove/lower the impact given by low quality data. For example, filter out low counted aggregation record.
Finally, always ask questions. When something is weird, ask. When you think something is interesting, ask. When we ask more, we get much more.