Preface
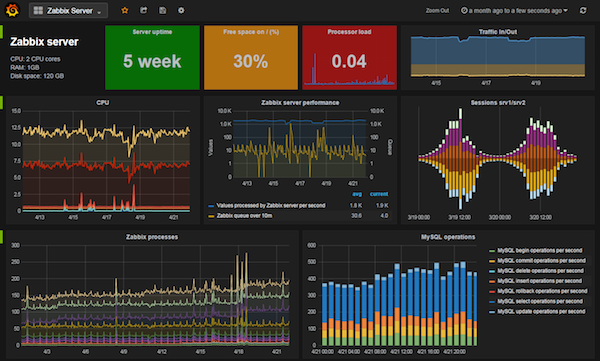
When I first saw Grafana, I was astonished by its beauty immediately and I believe it should be the very tools for most dashboard / monitor use cases. This 10,000+ stared project provide a complete solution for metrics and analytics.
Check this live demo and you should feel the same pleasure as I do.
How does Grafana work
In short, Grafana is a metric solution which include UI Render / Query / Data Source features.
UI Render is amazing; Different types of Queries are supported and it provide a wide range of Data source (mostly time series DB) support.
So, to setup a Grafana for our own use, what should we do?
- First we need to setup the data source.
- Second, we setup Grafana server and connect it with the data source.
- Thrid, we feed data into the data source
That’s it!
Setting up
The following article will cover how to set all the stuff up under Mac OSX. Although we have homebrew and pip, but it take more effort than it seems to be.
Graphite as Data Source
First of all, we are going to choose the data source first. Grafana provide a lot of DB support including: Graphite, Elasticsearch, CloudWatch, InfluxDB, OpenTSDB, KairosDB, Prometheus,
I will take Graphite as our primary data source, with the following reasons:
- powerful data APIs
- friendly render APIs with image accessing
- using whisper file to store data, operation friendly
- overall the design of Graphite is very clean, every layer of the design is scalable.
Setting up Graphite
To setup Graphite, please refer to the installation doc but some of them are not quite straight forward, so here is the steps I used to install everything. Before we getting start, make sure you have Homebrew and pip well-setup.
Install all dependencies
Cairo and Django is needed to render on Graphites’ own. And we should use a specific version of Cairo since the latest 14.x version make fonts on graphite web very huge.
cd /usr/local/Library/
git checkout 7073788 /usr/local/Library/Formula/cairo.rb
brew install cairo
brew install py2cairo
sudo pip install cairocffi

pip install Django==1.8
pip install django-tagging
Install Graphite with pip
pip install https://github.com/graphite-project/ceres/tarball/master
pip install whisper
pip install carbon
pip install graphite-web
it’s also recommended change the owner of Graphite directory if graphite is installed by root viasudo chown -R <your username> /opt/graphite
Configure Graphite
using the following commands make all default setting works.
cd /opt/graphite
cp conf/carbon.conf{.example,}
cp conf/storage-schemas.conf{.example,}

cd webapp/graphite

# Modify this file to change database backend (default is sqlite).
cp local_settings.py{.example,}

python manage.py syncdb
Launch Carbon & Graphite
python /opt/graphite/bin/carbon-cache.py start
python /opt/graphite/bin/run-graphite-devel-server.py /opt/graphite
(We could just ignore this error: WHISPER_FALLOCATE_CREATE is enabled but linking failed.)
Running Graphite from /opt/graphite under django development server

/usr/local/bin/django-admin runserver --pythonpath /opt/graphite/webapp --settings graphite.settings 0.0.0.0:8080
erforming system checks...

System check identified no issues (0 silenced).
July 20, 2016 - 10:05:58
Django version 1.8, using settings 'graphite.settings'
Starting development server at http://0.0.0.0:8080/
Quit the server with CONTROL-C.
If everything goes well, we should see something like this and see Graphite runs well without broken image.
Once you see the broken Image icon, go to http://0.0.0.0:8080/dashboard/ and you should see some python stack trace. My issue is that cairocffi is not correctly installed. Fix it till the web page doesn’t complain any more.
Feeding data into data source
Now you might be curious, what’s “carbon”? Carbon is a daemon listen for time-series data and can accept it over a common set of protocols. carbon-cache.py accepts metrics over various protocols and writes them to disk as efficiently as possible. This requires caching metric values in RAM as they are received, and flushing them to disk on an interval using the underlying whisper library. It also provides a query service for in-memory metric data points, used by the Graphite webapp to retrieve “hot data”.
So following the documentation, we now use the “plaintext” protocal to send some data to the data sources every 60 seconds via the following commands
1 | watch -n 60 -d 'echo "local.random.diceroll `jot -r 1 1 6` `date +%s`" | nc -c 127.0.0.1 2003' |
basically it generate a random integer between 1 and 6 for metric “local.random.diceroll” with a timestamp, send it to the data source which listen port 2003 on local host every 60 seconds. you could dig deeper by pasting the command to explainshell.com if you don’t quite understand how it works.
Now if we check the log via1
tailf /opt/graphite/storage/log/carbon-cache/<instance name>/console.log
You should see something like:1
20/07/2016 21:58:36 :: Sorted 1 cache queues in 0.000091 seconds
which mean carbon have successfully receive the data
Then, go to the graphite webapp on localhost:8080, there should be another new node under “Tree” Tab, “Metrics” -> “local” -> “random” -> “diceroll”
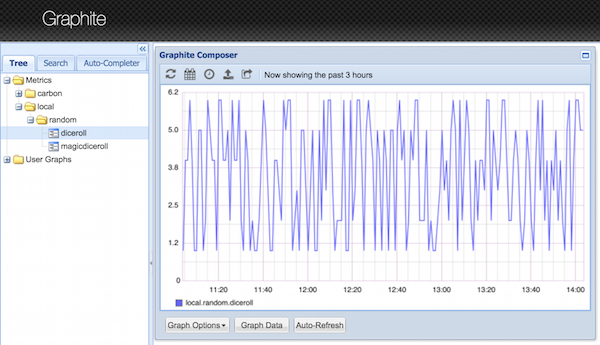
Bingo! Now only one step to visualize it on Grafana
Caution, There is one config file storage-schema you should pay attention to. With default settings, one could only feed data with a timestamp which is less than 24 hours because it will match the pattern here.
[default_1min_for_1day]
pattern = .*
retentions = 60s:1d
As the manual suggest, ‘The first pattern that matches the metric name is used’, so the new sections for your own data should be place on top of the ‘default_1min_for_1day’ section. For example, if all of my metrics are started with ‘koro’, then the config file will be like:
1 | [koro] |
Grafana
Now instal Grafana via Homebrew and find where Grafana is installed,
1 | $ brew install grafana |
It’s suggested to check the Grafana Doc about configurations:
http://docs.grafana.org/installation/configuration/
https://www.linode.com/docs/uptime/monitoring/deploy-graphite-with-grafana-on-ubuntu-14-04
but it’s also ok to use the default settings.
Starting Grafana Server
Well, it seems there is a bug on 3.0.1 so starting Grafana from command line is tricky. we should go to the ./share/grafana to run following command:
1 | /usr/local/Cellar/grafana/3.0.1/share/grafana (master) |
Or else You could get error like:
1 | [log.go:84 Fatal()] [E] Failed to parse defaults.ini, open /usr/local/Cellar/grafana/3.0.1/conf/defaults.ini: no such file or directory |
See issue #4531 for more information.
then goto localhost:3000 you should see the login UI, use the default admin user/password pair in the defaults.ini to login.
Connect Grafana with Graphite
after login, we could navigate from ‘top left icon’ -> ‘data sources’ to configure which data source grafana could use (or we could use http://localhost:3000/datasources/edit/1 directly).

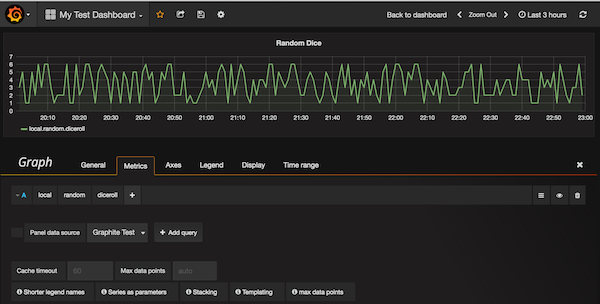
And now we could setup a new dashboard!
‘top left icon’ -> ‘Dashboards’ -> ‘New’ to add a new graph
Then go to the ‘Graph’ section of current Dashboard, go to the metrics tab, add “local”|”random”|”diceroll” as metrics name, and you should see the data points pops into the panel immediately.